Stage Analysis
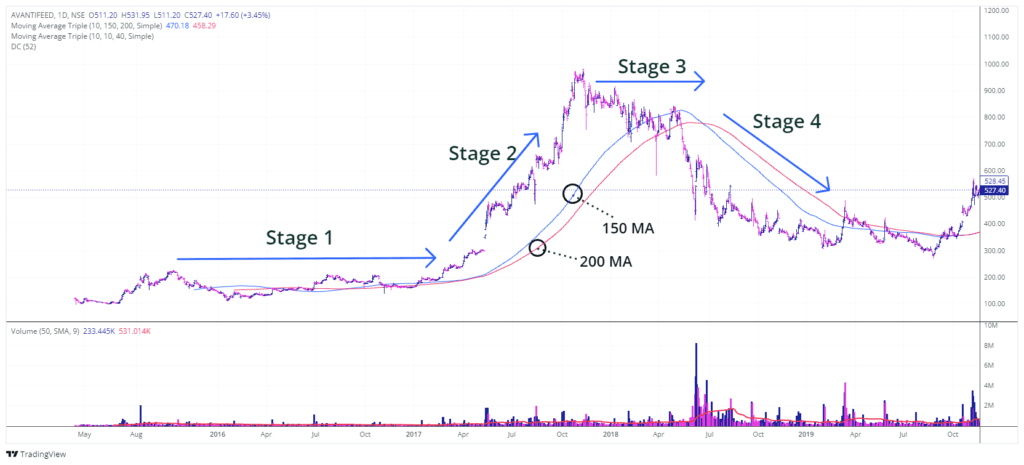
These are the four main stages into which Stage Analysis is typically categorized. Experienced traders compare the stock market to a living thing with its own cycles and rhythms.
Stage 1 (Neglect Phase: Consolidation),
Stage 2 (Advancing Phase: Accumulation),
Stage 3 (Topping Phase: Distribution), and
Stage 4 (Declining Phase: Capitulation).
Each of these stages has unique characteristics that can help traders identify potential trading opportunities and risks.
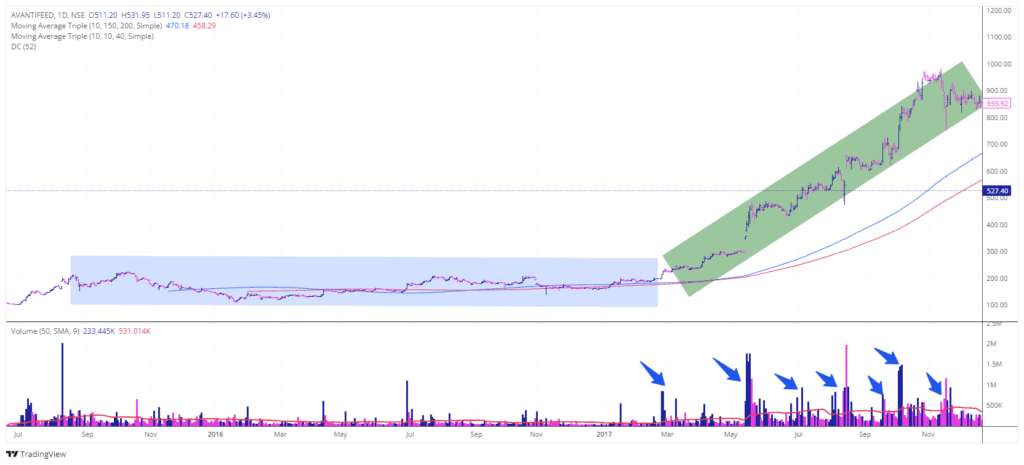
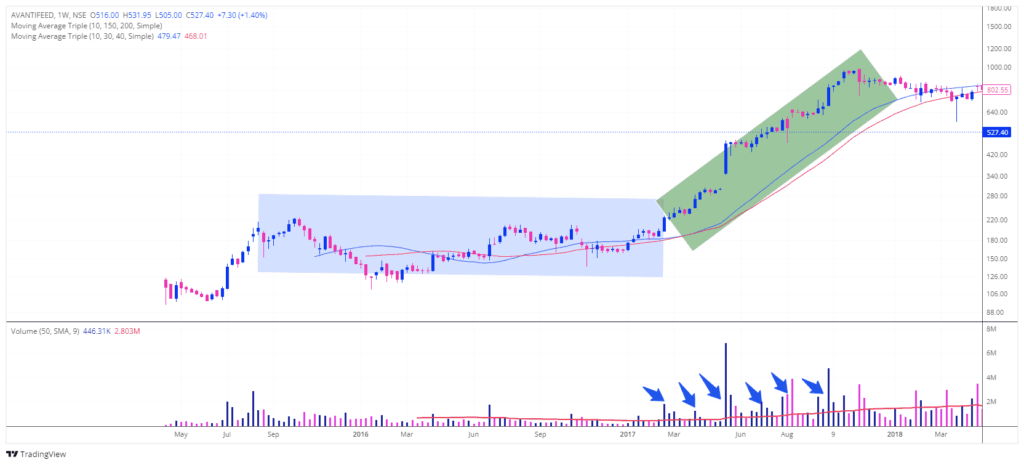
Stage 1: The Neglect Phase – Consolidation
Imagine you’re at a busy city square where people are milling around without a clear destination. They might pause for a moment, chat with friends, or check their phones, but there’s no real movement in any particular direction.
This is akin to Stage 1 of the stock Stage Analysis, where the stock price moves sideways without a sustained trend.
Characteristics of Stage 1
- Sideways Movement:
- During this phase, the stock price oscillates around its 200-day moving average, lacking any real trend. It’s like a boat drifting in calm waters with no wind to push it forward or backward.
- Lack of Trend:
- This phase can last for months or even years, representing a period where the stock is “dead in the water.”
- Volume Contraction:
- Volume during this stage is generally light compared to the volume seen during a previous decline (Stage 4). It’s as if the excitement has faded, and fewer traders are paying attention.
In Stage analysis, Stage 1 often follows a significant decline in the stock’s price (Stage 4), leaving the stock in a basing phase where it gathers strength before making a move. For traders, this is a waiting game, akin to watching clouds gather before a storm—there’s potential, but patience is required.
Stage 2: The Advancing Phase – Accumulation
Now, imagine the sun breaking through the clouds and people starting to move purposefully towards a destination. This is Stage 2 in stage analysis, where the stock price begins to rise, attracting more attention and activity.
Characteristics of Stage 2
- Above 200-Day Moving Average:
- The stock price climbs above its (40-week) 200-day moving average, signaling a bullish trend.
- Uptrend in Moving Averages:
- Both the (40-week) 200-day and (30-week) 150-day moving averages are trending upwards, with the 150-day moving average positioned above the 200-day moving average.
- Clear Uptrend:
- The stock exhibits a clear uptrend, forming higher highs and higher lows in a staircase pattern. It’s like climbing a hill, taking two steps forward and one step back.
- Volume Spikes on Ups:
- Volume increases on days when the stock price surges, indicating strong buying interest. Conversely, volume contracts during minor pullbacks, suggesting these are healthy corrections rather than signs of weakness.
- More Up Days:
- There are more days with significant upward price movement on above-average volume compared to down days.
For traders, Stage 2 is the golden spot to focus on stage analysis. It’s like a fruit tree in full bloom—there’s growth, and the potential for profit is high. This is the time to be actively looking for buying opportunities, as the stock has strong momentum behind it.
Stage 3: The Topping Phase – Distribution
Picture a bustling market that suddenly starts to experience occasional disruptions. Sellers begin to outnumber buyers, and the once steady stream of activity becomes erratic. This is Stage 3 in stage analysis, where the stock’s uptrend begins to falter and volatility increases.
Characteristics of Stage 3
- Increased Volatility:
- The stock experiences wider and more erratic swings, reflecting uncertainty among traders.
- Major Price Breaks:
- There are significant price breaks on increased volume, often marking the largest declines since the beginning of Stage 2.
- Undercutting the 200-Day Moving Average:
- The stock may dip below its 200-day moving average, bouncing above and below it multiple times. This indicates a struggle to maintain the previous uptrend.
- Flattening Moving Averages:
- The 200-day moving average loses its upward momentum, flattens out, and eventually starts to trend downward.
Stage 3 is like a roller coaster reaching its peak—exciting but filled with uncertainty about the next move. This is an instance of exercising vigilance for traders. It’s essential to monitor for signs of distribution where large players might be offloading their shares, preparing for a potential downturn.
Stage 4: The Declining Phase – Capitulation
Finally, envision a once-busy marketplace that’s now eerily quiet, with most stalls closed and only a few stragglers around. This is Stage 4 in stage analysis, where the stock price plummets, and fear dominates the market.
Characteristics of Stage 4
- Below 200-Day Moving Average:
- The stock price remains predominantly below the 200-day moving average, confirming a bearish trend.
- Downtrend in Moving Averages:
- The 200-day moving average, which flattened or turned downward in Stage 3, is now clearly trending down.
- Near 52-Week Lows:
- The stock price approaches or hits new 52-week lows, reflecting significant selling pressure.
- Lower Lows and Highs:
- The price pattern shows lower lows and lower highs, descending in a staircase pattern.
- Volume Spikes on Downs:
- Volume spikes on major down days and weeks, contrasting with low-volume rallies.
- More Down Days:
- There are more days and weeks with significant downward price movement on above-average volume compared to upward movements.
Stage 4 is akin to a harsh winter—the days are short, cold, and often brutal. For traders, this is a time to be defensive. It’s crucial to manage risks, perhaps by reducing exposure to declining stocks and waiting for signs of a potential bottoming process before considering re-entry.
Navigating the Stages: Practical Tips for Traders
Recognizing Stage Transitions
Identifying the transition between these stages In stage analysis is key to successful trading. Here are some practical tips:
- Use Moving Averages:
- The (40-week) 200-day and (30-week) 150-day moving averages are your guides. Their direction and relationship to the stock price can signal changes in market stages.
- Volume Analysis:
- Pay attention to volume patterns. Increasing volume on up days and decreasing volume on pullbacks during Stage 2 indicates strength. Conversely, rising volume on down days during Stage 4 signals weakness.
- Price Patterns:
- Look for higher highs and higher lows in Stage 2, and lower lows and lower highs in Stage 4. Erratic price behavior in Stage 3 often precedes a downturn.
Strategies for Each Stage
- Stage 1 (Consolidation):
- This is a waiting period. Avoid making large commitments. Instead, watch for signs of an emerging trend.
- Stage 2 (Accumulation):
- This is the time to buy. Look for stocks breaking out with strong volume, and consider adding to positions on pullbacks.
- Stage 3 (Distribution):
- Be cautious. Start tightening stop-loss levels and consider taking profits. Watch for signs of major price breaks.
- Stage 4 (Capitulation):
- Focus on risk management. Reduce exposure to declining stocks and wait for the market to bottom out.
Managing Emotions
The emotional roller coaster of trading can be challenging. Here’s how to stay grounded:
- Stay Informed:
- Regularly update your knowledge of market conditions and stock-specific news.
- Stick to a Plan:
- Have a well-defined trading plan and stick to it. This includes knowing when to enter and exit trades.
- Control Risk:
- Use stop-loss orders to protect your capital and avoid making impulsive decisions based on emotions.
Conclusion
Understanding the four stages of the stock stage analysis can significantly enhance your trading strategy. By recognizing the characteristics of each stage and implementing appropriate strategies, you can navigate the market with greater confidence and precision.
Remember, the market is like a living entity with its own cycles. Patience, discipline, and continuous learning are your best allies in this dynamic environment.
If you found this article helpful, please share it with fellow traders.
Disclaimer
This content is for educational purposes only and does not constitute any buy or sell recommendations. Always conduct your own research before making investment decisions.