
Table of Contents
Stage 2 Stocks:
Navigating the stock market requires skill, knowledge, and the right tools. Among these tools, the Minervini Trend Template stands out as a powerful method for identifying stocks poised for significant upward movement, commonly referred to as Stage 2 stocks. In this comprehensive guide, we will delve into the parameters of the Trend Template and explore how they can be used to pinpoint Stage 2 stocks. By the end, you’ll have a clear understanding of how to use this technique to enhance your trading strategy.
Understanding Stock Market Stages
To appreciate the significance of Stage 2 stocks, it’s essential to understand the four primary stages in a stock’s life cycle:
- Stage 1: Accumulation – This phase occurs after a prolonged decline, where the stock trades in a range and shows signs of bottoming out. During this stage, institutional investors often start accumulating shares.
- Stage 2: Uptrend – The stock breaks out of its trading range and begins a significant upward movement, characterized by increasing volume and higher prices. This is the most profitable stage for investors.
- Stage 3: Distribution – After a prolonged uptrend, the stock starts to trade sideways as large investors begin to sell their shares. This stage often precedes a downtrend.
- Stage 4: Downtrend – The stock enters a downward phase, marked by declining prices and increasing volume as investors sell their holdings.
Stage 2 is the sweet spot where the most significant gains are realized. Identifying stocks entering or already in Stage 2 can provide substantial investment opportunities. The Trend Template is designed to help you find these stocks.

The Trend Template: An Overview
The Trend Template, developed by Sir Mark Minervini, consists of a set of criteria that collectively indicate a strong stock. Here are the key parameters:
- Current stock price > 150-day (30-week) moving average
- Current stock price > 200-day (40-week) moving average
- 150-day moving average > 200-day moving average
- 200-day moving average trending up for ≥ 1 month (preferably 4–5 months)
- 50-day (10-week) moving average > 150-day moving average
- 50-day (10-week) moving average > 200-day moving average
- Current stock price > 50-day moving average
- Current stock price ≥ 30% above its 52-week low
- Current stock price within ≤ 25% of its 52-week high
Let’s break down how each of these parameters helps identify Stage 2 stocks.
Daily Timeframe

Breaking Down the Trend Template Parameters
1. Current Stock Price Above the 150-day and 200-day Moving Averages
This criterion ensures that the stock is performing well over both the medium and long-term periods. When a stock’s current price is above both the 150-day and 200-day moving averages, it indicates a strong upward trend. It’s like driving a car above the average speed on a long highway journey, suggesting momentum and sustained performance.
2. The 150-day Moving Average Above the 200-day Moving Average
When the 150-day moving average is above the 200-day moving average, it signals that the stock’s recent performance is stronger than its long-term trend. This crossover is a bullish signal, much like realizing that your car’s recent fuel efficiency is better than your long-term average.
3. The 200-day Moving Average Trending Up
A 200-day moving average trending up for at least a month, preferably four to five months, shows that the stock has been consistently gaining strength. This is akin to a long-term weather forecast predicting favorable conditions, reinforcing the stock’s stability and growth potential.
4. The 50-day Moving Average Above Both the 150-day and 200-day Moving Averages
The 50-day moving average being above both the 150-day and 200-day moving averages indicates strong recent performance. It’s like your car speeding up and maintaining a higher speed than it has over longer trips, showcasing robust short-term momentum.
5. Current Stock Price Trading Above the 50-day Moving Average
When a stock’s current price is above the 50-day moving average, it shows ongoing short-term strength. This scenario is like consistently driving above the speed limit on a recent trip, suggesting continued acceleration and momentum.
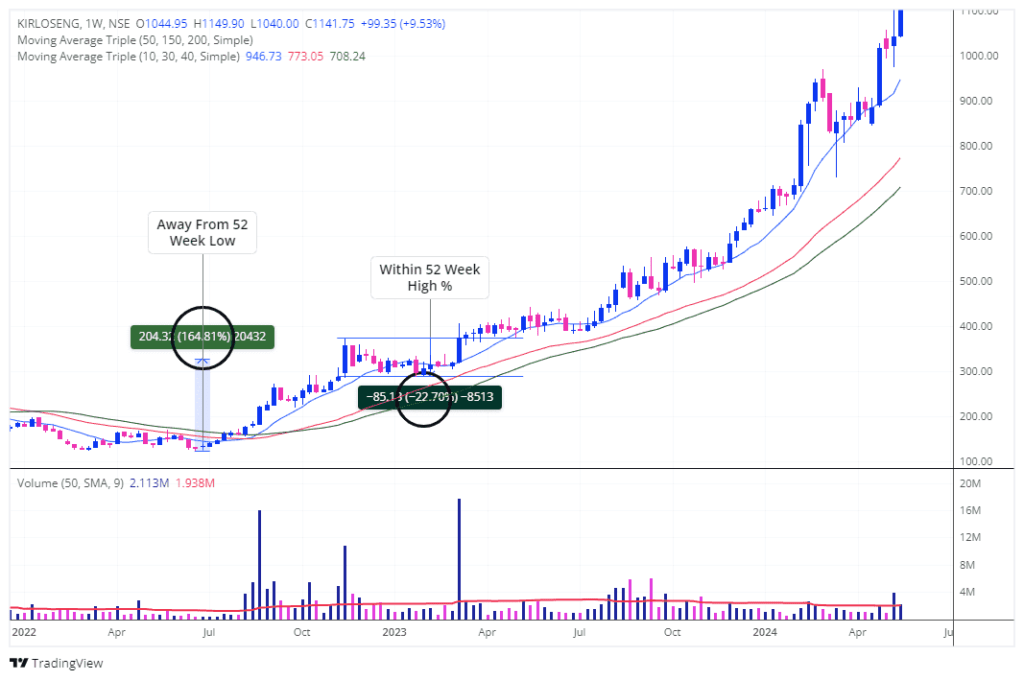
6. Current Stock Price at Least 30 Percent Above its 52-week Low
A stock trading at least 30 percent above its 52-week low indicates significant recovery and strength. Imagine your car’s fuel efficiency improving drastically from its lowest point; similarly, the stock has rebounded significantly, signaling the potential for further growth.
7. Current Stock Price Within 25 Percent of its 52-week High
A stock trading within 25 percent of its 52-week high suggests it is close to breaking into new highs. This proximity to its peak performance is a positive sign, much like nearing the top speed your car can achieve, indicating strong potential for further acceleration.
Weekly Timeframe
Applying the Trend Template: A Step-by-Step Guide
Step 1: Screening for Potential Stage 2 Stocks
Start by using screening websites or trading platforms that offer screening tools to filter stocks based on the Trend Template criteria. Look for stocks that meet the parameters related to moving averages, price performance, and relative strength rankings.
Trading Strategies to Trade Stage 2 Stocks for Swing Trading:
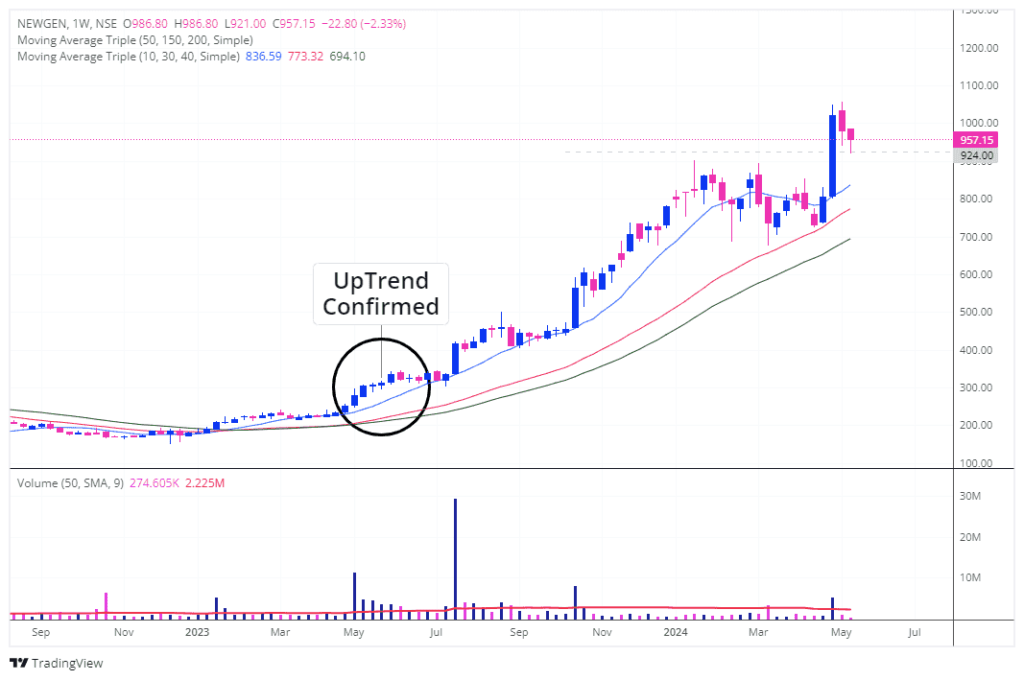
Step 2: Chart Analysis
Once you have a list of potential candidates, analyze each stock’s chart to ensure it meets all the Trend Template criteria. Confirm that the current price is above the 150-day and 200-day moving averages, the 150-day moving average is above the 200-day, and so on. This thorough check is crucial to ensure the stock is in a strong uptrend.

Step 3: Continuous Monitoring
After investing in Stage 2 stocks, monitor their performance regularly. Ensure they continue to meet the Trend Template criteria to confirm their ongoing Stage 2 status. Adjust your portfolio as necessary, selling stocks that no longer meet the criteria and reinvesting in new Stage 2 opportunities.

Enhancing Your Strategy
Diversification
While the Trend Template helps identify strong stocks, it’s essential to diversify your portfolio across different sectors and asset classes. Diversification mitigates risk and enhances potential returns by spreading your investments.
Fundamental Analysis
Complement your technical analysis with fundamental analysis. Examining a company’s financial health, earnings reports and industry trends provides a deeper insight, helping you make more informed decisions.
Staying Informed
Keep up with market news and trends. Economic indicators, geopolitical events, and industry developments can impact stock performance. Combining the Trend Template with current market insights ensures you’re making well-rounded investment decisions.
Conclusion: Your Path to Successful Trading
The Trend Template is a powerful tool for identifying Stage 2 stocks, characterized by strong uptrends and robust growth potential. By following its parameters, you can systematically find and invest in high-performing stocks. Remember, while the Trend Template offers a structured approach, staying informed and diversifying your strategy are key to long-term success in the stock market.
With these insights, you are well-equipped to navigate the complexities of the stock market and seize profitable opportunities.
We hope you find our guide on identifying Stage 2 stocks using the Trend Template both informative and beneficial. If you believe this article can help others in their trading journey, please share it with your network. Your support can empower more investors to make informed decisions and achieve their financial goals.
Disclaimer: This article is intended for educational purposes only and does not constitute buy or sell recommendations. Always conduct your own research or consult with a financial advisor before making any investment decisions.