
Table of Contents
Introduction – Bullish Base Breakout
One strategy that stands out for its contrarian approach is the Bullish Base Breakout. In the dynamic world of trading, seasoned traders often find themselves navigating through various strategies, each presenting its own set of opportunities and challenges.
This strategy, although contrarian in nature, has proven to be highly effective in capturing short-term gains in the market. In this comprehensive guide, we delve into the intricacies of the Bullish Base Breakout strategy, exploring its characteristics, key indicators, and how traders can capitalize on its potential.
Characteristics of the Bullish Base Breakout
The Bullish Base Breakout strategy is not your typical trend-following approach. Instead, it involves identifying stocks that are in a downtrend but have formed an extended sideways base. This sideways movement signals a shift in momentum, indicating a potential bullish reversal.
Unlike traditional trend-following strategies, the Bullish Base Breakout strategy relies on contrarian principles, making it an appealing option for traders looking to capitalize on market inefficiencies.
Key Indicators
To effectively implement the Bullish Base Breakout strategy, traders rely on two key technical indicators: the Moving Average Convergence Divergence (MACD) and the On Balance Volume (OBV). These indicators provide valuable insights into price momentum and accumulation, helping traders identify high-probability trade setups.
- MACD:
- The MACD indicator measures the relationship between two moving averages, typically the 12-day and 26-day exponential moving averages. In the context of the Bullish Base Breakout strategy, traders look for a series of higher lows on the MACD Indicator while the stock price is within the consolidation base. This divergence between price action and the MACD histogram signals increasing momentum and strengthens the bullish case.
- OBV:
- The On Balance Volume indicator measures cumulative buying and selling pressure based on volume flow. In the Bullish Base Breakout strategy, traders look for the OBV to rise above a trendline drawn over the tops of the indicator. This upward movement in OBV confirms accumulation and adds conviction to the bullish thesis.
Implementing the Bullish Base Breakout Strategy
Now that we understand the characteristics and key indicators of the Bullish Base Breakout strategy, let’s explore how traders can effectively implement this strategy in real-world trading scenarios.
- Identify Downtrending Stocks:
- The first step in implementing the Bullish Base Breakout strategy is to identify stocks that are in a downtrend. This can be determined by analyzing the stock’s price action over the past three months. Downtrending stocks exhibit lower highs and, preferably, lower lows, signaling sustained selling pressure.
- Confirm Consolidation Base:
- Once a downtrending stock has been identified, traders look for a consolidation base that forms at the bottom of the downtrend. This consolidation base can take the form of triangles or rectangles and indicates a period of price stabilization before a potential breakout.
- Validate Bullish Base:
- To confirm that the consolidation base is bullish, traders refer to the MACD and OBV indicators. The MACD should show a series of higher lows, indicating increasing momentum, while the OBV should rise above a trendline, confirming accumulation.
- Trigger Buy Signal:
- A buy signal is triggered when the price closes higher than the open, typically following the breakout from the consolidation base. Alternatively, traders can enter the trade on the day of an OBV break if the candle is green or white, further confirming bullish momentum.
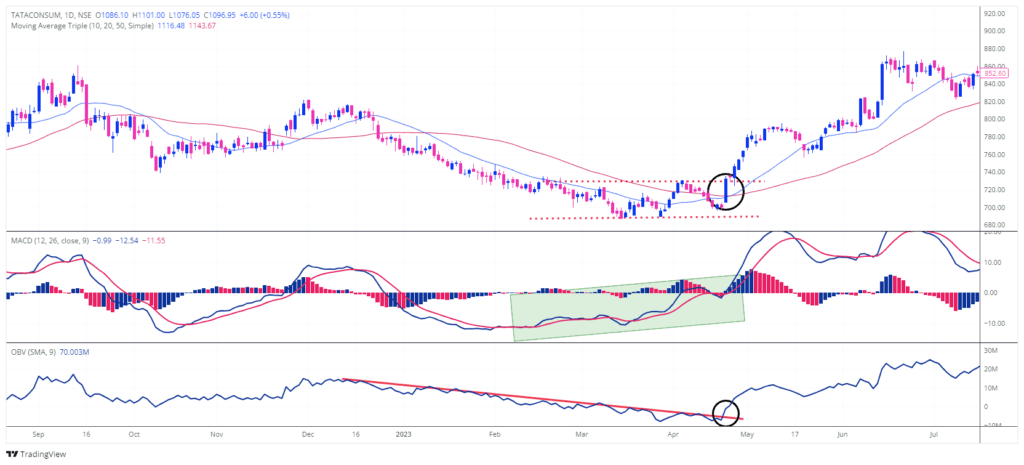
Daily Chart: TATACONSUM
Benefits of the Bullish Base Breakout Strategy
The Bullish Base Breakout strategy offers several benefits for traders:
- Short-Term Gains:
- While longer holds of this setup can yield significant gains, traders often experience a quick burst of buying activity at the point of breakout, resulting in gains of 10 percent or more within a few days. This makes it an ideal strategy for capturing short-term profits.
- Contrarian Approach:
- By bucking the trend and identifying bullish setups within down-trending stocks, the Bullish Base Breakout strategy allows traders to capitalize on market inefficiencies and profit from potential reversals.
Daily Chart: ZOMATO

Recap
To effectively implement the Bullish Base Breakout strategy, traders begin by identifying downtrending stocks, characterized by consistent lower highs over three months. Strong downtrends feature a falling 20-day MA below a declining 50-day MA, while weak ones show fluctuating 20-day MAs mostly below the 50-day MA.
Next, traders analyze price movement over 30 trading days, seeking consolidation bases, mainly triangles or rectangles, at downtrend bottoms. It’s crucial to avoid rising wedge patterns, which typically signal downtrend continuation.
Once a consolidation base is identified, traders confirm its bullish nature using MACD and OBV indicators. MACD should show higher lows, while OBV should rise above its trendline.
Finally, a buy signal is triggered by the first bullish candlestick after an OBV trendline breakout. Alternatively, traders can enter on the day of the OBV break if the candlestick is bullish, maximizing profit potential. These criteria ensure traders capitalize on Bullish Base Breakout opportunities, guiding them toward strategic entry points for success in the market.
While the Bullish Base Breakout strategy holds profit potential, no trading method is foolproof. Use a stop-loss strategy to safeguard against losses. Placing stop orders strategically can limit potential downsides. With disciplined risk management, traders navigate market uncertainties more confidently. Preserve capital for long-term success in trading.
Weekly Chart: NBCC

In Conclusion
The Bullish Base Breakout strategy offers a compelling approach for traders looking to capitalize on short-term opportunities in the market. By identifying stocks in a downtrend that have formed a bullish consolidation base, and confirming the setup with key technical indicators such as the MACD and OBV, Traders can set themselves up for success in the ever-changing trading industry—credit to Thomas Carr for inspiring elements of this Bullish Base Breakout strategy.
While no strategy is without risk, the Bullish Base Breakout strategy provides a systematic framework for identifying high-probability trade setups and maximizing profit potential.
If you found this article on the Bullish Base Breakout strategy helpful, consider sharing it with your fellow traders and friends who might benefit from this valuable information. Sharing is caring, and by spreading the word, you’re not only helping others improve their trading skills but also contributing to a more knowledgeable and informed trading community.
So, whether it’s through social media, email, or word of mouth, don’t hesitate to pass along this article and help empower others to succeed in their trading endeavors. Together, we can all grow and thrive in the world of trading.
Disclaimer
Before you proceed, it’s important to understand that the information provided in this article is for educational purposes only. It is not intended as financial advice or a recommendation to buy or sell any stocks or securities.
Trading in the financial markets involves inherent risks, and decisions should be made based on your own research, analysis, and risk tolerance. While the Bullish Base Breakout strategy outlined in this article can serve as a valuable tool for traders, it’s essential to conduct thorough due diligence and consult with a qualified financial advisor before making any investment decisions.
Remember, education is key to success in trading, but ultimately, the responsibility for your investment decisions rests with you.